Technical Manual for Installation Dams Modeling, Mapping, and Consequences
Executive Summary
The Modeling, Mapping and Consequences (MMC) Production Center is committed to perform, develop, and provide modeling, mapping, and consequence analyses products to facilitate the capture and communication of project risks across the United States Army Installation dams. The MMC recognized the need to understand risks from all project features. As a result, an Army Installation Dams standard operating procedure (SOP) technical manual, in support of developing the potential models and consequences for dams on, alongside, or near Army Installations, is performed for any structure to assess and estimate population at risk and economic damages.
This SOP outlines the roles and responsibilities of MMC engineers, economists, technical writers, and geographic information system (GIS) technicians involved in the creation of the Army Installation Dam products and an analysis report detailing the results of the rapid assessment.
Section 1 - Reference Material
The MMC documentation team gathers reference materials required for completion of the Army Installation Dam report using the national inventory database (NID), district or installation contacts, and previous model reports.
1.1 District Resources
The assigned MMC team member contacts the district or installation office in an attempt to acquire project-specific, relevant reference material.
If directed to do so, collect data from districts electronically via MMC ProjectWise or MMC File Share. However, if district personnel do not have access, data can be transferred via FTP using the following web service: https://filetransfer.usace.army.mil, if possible. If necessary, temporary media or storage devices can be used for transferring data. Another option to collect data from districts electronically is to use ProjectWise.
It is the responsibility of the assigned modeler to examine the quality and completeness of the data provided in the pre-model dataset. The modeler coordinates with the MMC Team Lead, and the home installation or district contacts to ensure the best available data is being used as a starting point.
1.2 folder creation and References
The assigned MMC documentation team member creates a project folder on the MMC Team SharePoint site under the Army_Installation_Dams documentation library to load the latest report templates and consequence-based top screening (CTS) worksheet to the project folder.
The documentation member creates an Archive, Map, and References folder under the main project folder on SharePoint. The member loads the references from the aforementioned resources into the References project folder. The member runs the optical character recognition (OCR) on any downloaded portable document format (PDF) documents to become searchable documents.
The documentation member creates a project folder on the MMC File Share under the Production / Dams / Army folder structure. The naming convention will include the NIDID and the project name. For example, TX02349_Fort_Hood_Dam_46. Add the underscores in place of the spaces between the NIDID and project name for consistency.
1.3 Pre-Model Data Sets
The assigned modeler determines if pre-model data or an existing model data exists for the same geographic area, and if the data meets the needs for the Army Installation Dam project. If the existing model data is sufficient, no new pre-model data sets will be required. However, if the modeler has a need for the pre-model data sets, he or she contacts the project manager and the mapping technical lead by email with the request.
The assigned MMC mapping member prepares pre-model data sets as necessary, and posts the data to the MMC file share under the GIS_Modeling/PreRAS folder.
Section 2 - Hydraulic Model
2.1 Modeling, Mapping, and Consequences Modeling Team
The simplified models are set up using the Hydrologic Engineering Center-River Analysis System (HEC-RAS) 5.0 software. The model geometry consists of the dam modeled as an inline structure, the pool behind the dam modeled as a storage area, and the downstream reach of the dam modeled as a two-dimensional (2D) area. If an existing model is available, the use of cross-sections is also acceptable. Pertinent information necessary for the modeling include:
- Datum adjustment to NAVD 88 (collected by documentation team and reported in consequence-based top screen (CTS) worksheet)
- Pertinent structure data
- National Levee Database (NLD) alignments/elevations
- National Land Cover Database (NLCD)
- Ten meter or higher resolution DEM
- Storage curve for pool
- Top of active storage (TAS) and normal high (NH) elevations
- Current Inflow design flood (IDF) hydrograph for scaling TAS pool
- Any applicable rating curves for outlet works/spillway.
2.2 Projections
The standard projection for all MMC projects is:
- USA_Contiguous_Albers_Equal_Area_Conic_USGS_version
- The linear units are set to U.S. feet
- The MMC Production Center uses the North American Vertical Datum of 1988 (NAVD 88) for all elevation data.
2.3 Computational Requirements, Data Resources, and Data Transmission
This section outlines the resources needed for model development as well as information on MMC SharePoint collaboration sites which house the latest MMC program guidance. Information on data transmission for the modeling, mapping, and consequence production process is also covered in this section.
2.3.1 Hardware
The team member needs to be assigned a USACE Army Corps of Engineer-Information Technology (ACE-IT) desktop/laptop with the Science and Engineering specifications loaded. The team member may need to request an external hard drive to store production model scenario data sets locally. Requests for external hard drives can be submitted to the MMC team lead or MMC technical lead; however, available resources may be limited.
2.3.2 Administrative Rights
The MMC team members need to contact ACE-IT to install Beyond Trust to desktop or laptop computer assigned. The Beyond Trust software enables the MMC member to download and install the latest software versions or service packs for GIS and modeling applications. Depending on the local or ACE-IT requirements for the district, a form ENG-6030 may need to be filled out to acquire the proper Beyond Trust software. For additional information regarding administrative rights see Appendix 2.3.
2.3.3 Software
If Beyond Trust is not granted the team member may need to enter an ACE-IT Enterprise Service Desk (ESD) ticket with a request to apply the latest software or updates to the assigned hardware.
| Application | Version | Point of Contact |
|---|---|---|
| ArcGIS Desktop | 10.X (3D Analyst and Spatial Analyst) | Michelle Carey, NWK |
| HEC GeoRAS | 10.X | Cam Ackerman, HEC |
| HEC-RAS | 5.0.7 | Gary Brunner, HEC |
| HEC-DSSVue | 2.0.1 | Mike Perriman, HEC |
| Bentley ProjectWise | Current ACE-IT version | Carl Broyles, NWK |
2.3.4 SharePoint; Modeling, Mapping, and Consequences File Share; and ProjectWise (Collaboration) Sites
MMC SharePoint, MMC File Share, and ProjectWise sites contain program information, reports, documentation, and policies. The collaboration sites support a USACE-wide audience. The MMC ProjectWise server is located in the Kansas City District (NWK), and contains draft and final model data within project folders. ProjectWise access is required, and the MMC team member needs to email Carl Broyles (NWK) to request permissions. The MMC File Share is located on the western processing center (WPC) and is intended to be used for transfer of data internally within the MMC. The MMC Community of Practice (CoP) and the MMC Team SharePoint sites host an array of MMC data and viewers. In order to gain access to the MMC Team SharePoint site, the MMC team member needs to email Michelle Carey (NWK) to request access to the MMC Team SharePoint site (documentation) files. The SharePoint site and File Share links are:
-
HQUSACE level (MMC COP SharePoint):
https://cops.usace.army.mil/sites/HHC/CoPs/DS/MMC/SitePages/Home.aspx -
MMC Team SharePoint site (MMC Production: CTS worksheets and CAR
products):
https://team.usace.army.mil/sites/NWK/pdt/MMC/default.aspx -
MMC Production (MMC File Share):
\\wpc-netapp3.eis.ds.usace.army.mil\RMCSTORAGE4\PRODUCTION\DAMS.
The MMC program requires the use of a virtual production team for GIS
data production, modeling, consequence assessment, and review. Because
of data transfers required for analysis, a project folder is assigned
to each study dam on the MMC Shared Server. The project folder houses
all data used for the study throughout the entire process. The project
folder adheres to a standardized structure and originates with the
pre-model GIS data prepared by the mapping team. It is important that
all data within the project folder adheres to the standardized folder
structure presented in Figure 2-1. Non-pertinent and legacy data is not
to be uploaded to the hard drive or within the MMC File Share project
folder in order to maintain clarity. The MMC project folders for model
production and reviews are housed on the MMC File Share to maximize MMC
data and file management during the production process.
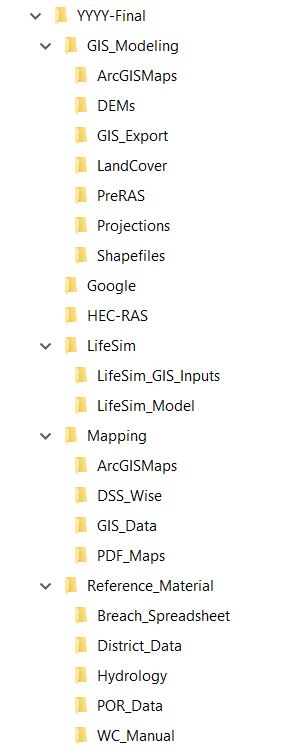
Figure 2-1. Modeling, Mapping, and Consequences Delivery File Structure
2.3.5 Funding Requests
Funding requests for MMC levee modeling work are entered through the online funding request system at: https://prod.mmc.usace.army.mil/frs/mmc/.
2.4 National Levee Database and National Land Cover Database
Develop terrain data by either clipping an area from the 10m National Elevation Dataset (NED) using the RapidDEM tool developed by Mike Koon, Huntington District (LRH), or using existing digital elevation model (DEM) from an available model. This tool does not merge in National Levee Database (NLD) terrain data, but the NLD levee elevations may be in the terrain if it was included in the source terrain from the NED.
Ground surface data obtained from outside sources for use in MMC Production Center dam studies should meet minimum accuracy and resolution requirements. Minimum resolution for the MMC Production Center is 10-meter grid format. Minimum accuracy for the MMC Production Center is NED. More accurate data (possibly at the same 10-meter resolution) may be used if available and not production prohibitive. Refer to Appendix 4.2.4 for more information on data resolution and accuracy.
Levee information from the NLD is provided to all modelers by the mapping technical lead independent of the pre-model data deliverable. The mapping technical lead coordinates with the NLD database manager and obtains updated NLD data layers at least once a year. The NLD includes information related to the levee centerline. The centerline is represented as a line element and points containing the elevation from the latest survey of the levee. The mapping technical lead or delegate needs to confirm a levee line of protection (LOP) is available that combines the levee segments with closures and other structures that complete the levee alignment.
Land coverage information from the National Land Cover Database (NLCD) is provided to all modelers by the mapping technical lead independent of the pre-model data deliverable. The provided shapefile includes the Manning’s “n” value associated with the land coverage type.
2.5 Modeling Process
2.5.1 Begin Model Setup
Begin model setup utilizing appropriate information as designated in step one.
- Hydrologic Engineering Center-River System Analysis (HEC-RAS) 5.0 software is used to create model geometry where existing geometry is not available or appropriate to model the range of required scenarios.
- Review CTS worksheet data, report, and reference data provided on SharePoint by the documentation team. Pertinent structure data in the model should match what is in the CTS worksheet.
- Pull data from either the CTS worksheet, the water control manual (WCM), or existing model for pertinent data for embankment, pool, and outlet works/spillway.
- Geometry data consists of one-dimensional (1D) storage area for pool upstream of dam, inline structure representing embankment, inline/lateral structure representing spillway, 2D area for reach downstream of dam, and break lines representing NLD alignment within model extent (if levee elevations are included in the terrain data; otherwise, internal structures should be used).
- Downstream model extents—Initial estimates of the downstream extent may be obtained from inundation areas identified within existing EAPs and other studies for the study dam or other dams along the same river reach. The model extent may extend past the current EAP, or extended downstream from the assigned dam to the point of no significant damages or until floodwaters are no longer out of bank, or are within the same extent defined by the non-breach scenario. Determining this extent may be an iterative process and require the additional model development. When establishing model extents, downstream sources of significant inflow, such as tributaries, that may have an effect on the dam breach flood wave should be considered.
- Dams located downstream of the studied dam—Downstream dams should be operated according to the WCM for the dam. A non-cascading breach response is considered as the official scenario for a given loading condition. If the modeled scenario on the dam creates conditions that exceed the storage or discharge capacity of the downstream dam(s) and overtopping occurs, it is documented in the Simplified Study Analysis Report that the downstream dam(s) should be considered for breach when full MMC products are developed.
- Studies ending in a downstream reservoir—In the case that significant damages end at a downstream reservoir, the controlling dam shall be included in the model, along with necessary downstream cross sections to properly model the structure. The dam should be operated according to the WCM for the inflow conditions.
- Studies ending along the coastline—In the case that the model ends along the coastline, the model should extend beyond the coastline and the downstream boundary condition should be set to the mean high water (MHW) or tidal time series (coordinate with district) in that area. The MHW can be found for several stations on the National Oceanic and Atmospheric Administration’s (NOAA’s) Tide and Currents website: ( http://tidesandcurrents.noaa.gov/stations.html?type=Datums )
- Inline structures (dams)—Dams modeled for MMC Production Center studies, as well as dams located in the downstream model extents, are to be included in the model as inline structures. Operating data should be obtained from the corresponding structure’s WCM where available.
-
Gates—All gates in a study dam shall be represented in the inline structure modeled in HEC-RAS. Rating curves from the WCM corresponding to each gate should be input into the model. Gate locations in the HEC-RAS model should approximately correspond to their physical location in the dam.
Gate operations (opening and closing) correspond to the WCM. Elevation control and rules are the preferred methods of operation; however, certain scenarios require the use of time series control. For additional guidance, see the HEC-RAS User’s Manual in Appendix 3.5.1, which provides information on gate modeling options within HEC-RAS.
- Two-dimensional area breaklines—significant interior restrictions to flow such as road embankments can have a major impact in the resulting inundation for a levee breach model and must be accounted for by modifying the computational mesh using 2D area. Openings or holes in embankments (such as highway underpasses) are also critical to achieving an accurate inundation result. If levee elevations are included in the terrain data, which may not always be the case, breaklines can be used define the levees. If inundation is incorrectly crossing leveed areas or the levees are not included in the terrain data, the use of internal connections with elevation data may be required.
- Two-dimensional area internal connections—the use of 2D area internal connections is an alternative to the use of breaklines. They have a great advantage in that they allow for the modeling of either gates or culverts directly within the structure, which is a convenient method for modeling a roadway embankment with underpasses.
- Two-dimensional grid spacing—Select appropriate grid spacing for the computational mesh that fits with the area being modeled. This takes some trial and error. Appropriate grid cell spacing varies based on factors such as the slope of the terrain, number of breaklines used, and practicality of file sizes/runtimes.
- Two-dimensional equation set—Initial production runs typically use the default 2D equation set diffusion wave. During the model verification process, it is recommended the modeler make at least one run using the full momentum equation set to check for any significant impacts to the flood extent, peak stages, or arrival times when compared to an identical scenario using the diffusion wave equation set. If there are significant differences between the two runs, the modeler should assume the full momentum equation is more accurate and proceed with that equation set. For breaching analysis, the flood wave rises and falls extremely quickly and the change in velocity (acceleration) is dramatic both over time and spatially. The diffusion wave equations exclude the local (changes in velocity with respect to time) and convective (changes in velocity with respect to distance) acceleration terms. These terms are extremely important in order to model rapidly rising flood waves.
-
Spatially-varied Manning’s “n” values—it is recommended that the roughness values be varied spatially in 2D flow areas. This can be accomplished by either drawing 2D area Manning’s “n” regions within the HEC-RAS geometric editor or importing a landuse coverage shapefile within the RAS Mapper program in HEC-RAS. A recommended source for the identification of roughness factors is the NLCD http://www.mrlc.gov/ and a general guide for the assignment of Manning’s “n” values based on land cover is provided in Table 2-2. In some cases the use of aerial photography to identify land cover and roughness is preferable.
For more on RAS 2-D see Appendix 3.1.33, Combined 1D and 2D Modeling with HEC-RAS, in the Technical Manual for Dams.
- Boundary conditions—Appropriate boundary conditions should be added to the 2D computational grid when needed so as to prevent artificial pooling. Downstream boundary conditions are set to appropriately model conditions at the downstream extent of the study. Normal depth is generally used for models with typical riverine characteristics at the downstream boundary. For areas that are affected by tidal influences the downstream boundary condition is set to the MHW in that area. The MHW can be found for several stations on NOAA’s Tide and Currents website http://tidesandcurrents.noaa.gov/stations.html?type=Datums. Other boundary conditions may be used with approval from the project lead.
| Land Cover ID | Land Cover Description | Manning’s “n” |
|---|---|---|
| 11 | Open Water | 0.025–0.03 |
| 21 | Developed, Open Space | 0.03–0.04 |
| 22 | Developed, Low Intensity | 0.04–0.06 |
| 23 | Developed, Medium Intensity | 0.04–0.07 |
| 24 | Developed, High Intensity | 0.06–0.07 |
| 31 | Barren Land | 0.025–0.035 |
| 41 | Deciduous Forest | 0.15–0.2 |
| 42 | Evergreen Forest | 0.14–0.18 |
| 43 | Mixed Forest | 0.18–0.2 |
| 52 | Shrub/Scrub | 0.09–0.11 |
| 71 | Grassland/Herbaceous | 0.06–0.08 |
| 81 | Pasture/Hay | 0.05–0.07 |
| 82 | Cultivated Crops | 0.045–0.065 |
| 90 | Woody Wetlands | 0.07–0.09 |
| 95 | Emergent Herbaceous Wetlands | 0.06–0.08 |
2.5.2 Develop the Modeling, Mapping, and Consequences Non-breach Scenarios
USACE established a standard set of five modeling scenarios covering a range of pool elevations, representing minimum and maximum normal operating conditions as well as select extreme loading conditions designed to capture the upper limit of potential downstream consequences; however, for installation dams, a smaller set of loadings mostly related to the pertinent information of the dam will be modeled. These scenarios are the Normal High (NH), Top of Active Storage (TAS), Top of Dam (TOD) (if necessary), and Maximum High (MH) Pools.
The Normal High Pool is defined as follows:
An unsteady flow simulation for non-breach and breach scenarios will be modeled for a NH water level, the 10-percent exceedance duration pool elevation. If period of record pool data is not available for the subject installation dam, the normal pool elevation shall be used for the NH pool elevation. Starting reservoir pool will correspond to the 10-percent exceedance duration or normal pool elevation. Reservoir inflow will be a constant inflow hydrograph as required to maintain the 10-percent exceedance duration or normal pool under normal gate operations. Gate operation procedures consistent with the latest WCM will be applied to the hydrograph routing. Consequence analysis will include damage and life loss (LL) estimates. A consequence analysis simulation for the non-breach condition is not necessary if non-damaging releases result from the NH pool event.
The NH scenario elevation corresponds to the ten percent exceedance duration or normal pool elevation (exceeded about 10 percent of the time or 36 to 37 days per year on average) which can be obtained under normal regulated operating conditions. This scenario represents a relatively-high, but normal, pool condition which can be expected to occur every year. This scenario is not associated with the occurrence of a flood event.
Develop MMC NH pool non-breach scenario within HEC-RAS.
- Starting reservoir pool corresponds to the 10-percent exceedance duration or normal pool elevation. If an existing model is available, use the available NH pool elevation as the starting pool. This elevation can also be captured from the Duration-Exceedance curve if available in the Water Control Manual, gage data, or “normal pool” elevation.
- Reservoir inflow will be a steady flow hydrograph. The steady flow hydrograph will be determined to maintain the normal high pool elevation. Gate operation procedures from the latest water control manual will be applied to the hydrograph routing.
- All scenarios should run to completion and meet requirements provided in the technical manual for dams.
The TAS pool is defined as follows:
An unsteady flow simulation for non-breach and breach scenarios will be modeled for the TAS water level. Starting reservoir pool will correspond to the NH pool elevation. Reservoir inflow will be a scaled inflow design flood hydrograph. The scaled hydrograph will be developed by scaling the available hydrograph using trial and error to produce a peak pool equal to the TAS elevation. Gate operation procedures from the latest WCM will be applied to the hydrograph routing. Consequence analysis will include damage and loss-of-life estimates. A consequence analysis simulation for the non-breach condition is not necessary since non-damaging releases result from the TAS event.
The TAS scenario corresponds to the highest elevation which can be obtained under normal regulated operating conditions for authorized purposes (i.e., without damaging releases). This scenario is associated with the occurrence of an unusual flood event. It does not include surcharge storage but should represent the pool elevation that, if exceeded, would result in significant increase in discharge based on the physical properties of the project and/or operation procedures from the latest WCM. The term active storage has similar meaning as the terms full pool and flood control pool. For typical flood risk management dams with uncontrolled spillways, the TAS corresponds to the emergency spillway crest elevation. For dams with controlled or gated spillways, the TAS commonly corresponds to an elevation that, if exceeded, the gates would begin to fully open. For some cases this may be at or near the top of the spillway gates.
Develop MMC TAS pool non-breach scenario within HEC-RAS.
- Starting reservoir pool corresponds to the NH pool elevation. If an existing model is available, use the available NH pool elevation as the starting pool. This elevation can also be captured from the Duration-Exceedance curve if available in the Water Control Manual, gage data, or “normal pool” elevation.
- Reservoir inflow will be a scaled inflow design flood hydrograph. The scaled hydrograph will be developed by scaling the available hydrograph using trial and error to produce a peak pool equal to the top of active storage elevation. Gate operation procedures from the latest water control manual will be applied to the hydrograph routing.
- All scenarios should run to completion and meet requirements provided in the technical manual for dams.
The TOD pool is defined as follows:
An unsteady flow simulation for non-breach and breach scenarios will be modeled for the TOD pool water level. Starting reservoir pool will correspond to the TAS pool elevation. Reservoir inflow will be a scaled IDF hydrograph. The scaled hydrograph will be developed by scaling the available hydrograph using trial and error to produce a peak pool equal to the TOD pool elevation. Gate operation procedures from the latest water control manual will be applied to the hydrograph routing. Consequence analysis will include damage and loss-of-life estimates. A consequence analysis simulation for the non-breach condition will be necessary as damaging releases should result from the TOd pool event.
NOTE:
This scenario is only modeled if the current IDF/PMF hydrograph overtops the main embankment.
The TOD scenario corresponds to an elevation that represents the crest elevation of the dam. It does include some surcharge storage and will likely result in a significant increase in discharge above downstream channel capacity based on the physical properties of the project and/or operation procedures from the latest WCM.
Develop MMC TOD pool non-breach scenario within HEC-RAS.
- Starting reservoir pool corresponds to the TAS pool elevation. If an existing model is available, use the available TAS pool elevation as the starting pool. This elevation can also be captured from the Duration-Exceedance curve if available in the Water Control Manual, gage data, or “normal pool” elevation.
- Reservoir inflow will be a scaled inflow design flood hydrograph. The scaled hydrograph will be developed by scaling the available hydrograph using trial and error to produce a peak pool equal to the TOD elevation. Gate operation procedures from the latest water control manual will be applied to the hydrograph routing.
- All scenarios should be run to completion and meet requirements provided in the technical manual for dams.
The MH pool is defined as follows:
An unsteady flow simulation for non-breach and breach scenarios will be modeled for the MH pool water level. The most current inflow design flood hydrograph, antecedent pool, and routing will be provided by the district. If an antecedent pool is not provided, the pool should be initially set to the TAS pool and then adjusted until the district-provided max pool is met. If the antecedent event causes downstream flooding, additional coordination with the consequence team member is recommended.
The MH scenario corresponds to the maximum inflow design flood (IDF) elevation. This scenario is associated with the occurrence of an extreme flood event and routed using the emergency operation procedures from the WCM. It includes full utilization of available surcharge, flood, conservation, inactive, and dead storage. Allowances for freeboard, wind setup, wave run up, and wedge storage (due to sloping reservoir WS) are typically not considered. For most ungated dams, uncontrolled spillway discharges will occur during the MH scenario resulting in significant downstream inundation for both with and without breach conditions. The MH scenario typically results in the greatest areal extent, depth of downstream inundation, and total economic consequences.
Develop MMC MH pool non-breach scenario within HEC-RAS.
- Starting reservoir pool corresponds to the 10-percent exceedance duration pool elevation. If an existing model is available, use the available NH pool elevation as the starting pool. This elevation can also be captured from the Duration-Exceedance curve if available in the Water Control Manual, gage data, or “normal pool” elevation.
- Reservoir inflow will be a scaled inflow design flood hydrograph. The scaled hydrograph will be developed by scaling the available hydrograph using trial and error to produce a peak pool equal to the top of active storage elevation. Gate operation procedures from the latest water control manual will be applied to the hydrograph routing.
- All scenarios should run to completion and meet requirements provided in the technical manual for dams.
2.5.2.1 Plan Files for Modeling, Mapping, and Consequences Scenarios
Every scenario modeled for the MMC Production Center has a separate HEC-RAS plan file. The plan file contains data designating the geometry and flow files associated with the particular plan or model scenario. The plan file also contains information on the simulation time window and computational settings. Breach parameters for the particular plan are also stored within the plan file.
Modeling specifics have been adopted by the MMC to maintain consistency and integrity for all models created as part of the program. This section covers HEC-RAS Project specifics such as naming conventions and description field information used by MMC.
- Naming Conventions—All models created for the MMC Production Center have specific naming conventions to provide consistency across the MMC program.
- Project Name—The HEC-RAS project file is named with the project name: “<NID Name of Dam>_NIDID” Example: TuttleCreek_KS00000.
- Geometry Name—All models created for MMC utilize a single geometry with the following naming convention: “<Name of Dam> <Failure Geometry>”
- Projection—The HEC-RAS geometry uses the standard MMC Projection of Albers Equal Area (detailed projection data included in Appendix 4.1.1)
- Vertical Datum—All elevations utilized in the HEC-RAS geometry must be in NAVD 88 feet datum.
Each scenario, breach and non-breach, created for the MMC production center has a separate plan file named as detailed in the table that follows. Each dam loading condition shares an unsteady flow file named according to Table 2-3. The HEC-RAS model geometry represents the physical constraints over which flow from the dam breach scenario is routed. In order to have a complete model, the constraints on both flow and time are developed for analysis. These constraints represent a range of loading conditions within the reservoir.
| Event | RAS Plan Name | Short ID | Unsteady Flow Data Name |
|---|---|---|---|
| 1 | Normal High—Non-Fail | NH Non-Fail | Normal High |
| 2 | Normal High—Fail | NH Fail | Normal High |
| 3 | Top of Active Storage—Non-Fail | TAS Non-Fail | Top of Active Storage |
| 4 | Top of Active Storage—Fail | TAS Fail | Top of Active Storage |
| 5* | Top of Dam—Non-Fail | TOD Non-Fail | Top of Dam |
| 6* | Top of Dam—Fail | TOD Fail | Top of Dam |
| 7 | Maximum High—Non-Fail | MH Non-Fail | Maximum High |
| 8 | Maximum High—Fail | MH Fail | Maximum High |
| *These scenarios are only modeled if the latest IDF overtops the main embankment | |||
A HEC-RAS plan file is required to set the time constraints, computational settings, and model output for each modeled scenario. In addition the breach plan is housed within the plan file.
A HEC-RAS flow file is required to specify inflow hydrographs, downstream flow conditions, and gate operations at the dam. Specifics regarding model flow files for MMC are presented in Section 2.5.2 of the SOP.
The combination of geometry, flow, and plan files is used to compute each model scenario. The model scenarios to be modeled for MMC are presented below.
- HEC-RAS Model Description. All models created for the MMC Production Center include a thorough description field that provides potential users with pertinent information and provides the MMC Production Center consequences team with information to populate the CTS worksheet. The following items are listed in the HEC-RAS model description field:
- Name of dam
- National Inventory of Dams (NID) Identification (ID)
- Location of dam and district
- Vertical datum and units
- Horizontal datum and units
- Horizontal projection
- Latitude/longitude
- MMC hydraulic modeler
- Interim reviewer
- Final reviewer
- MMC hydraulic team lead
- District contact person
- Status of model
- Date of last modification
- Program and version
- For Official Use Only
- Simulation Times. Computational times for the MMC Production Center model plans should follow the following specifications:
- Time step selection is based on the size of the grid cells and the velocity of the water in the cells. Computation intervals for two-dimensional flow areas are generally set between 5 and 60 seconds.
- Hydrograph output interval is 5 to 15 minutes.
- Detailed output interval is 5 to 15 minutes.
- The mapping output interval matches the hydrograph output interval.
- Simulation Start Time. All simulations begin February 2, 2099, at 2400 hours to avoid confusion with actual future flood events and maintain consistency between models.
- Simulation End Time. Simulations run until the peak of the flood wave has been routed through the model extent and water surface elevations at the most downstream cross section begin to recede.
2.5.2.2 Develop Breach Widths for the Pool Breach Scenarios
Breach parameters for breach scenarios follow the guidance presented below. It is recommended that the modeler successfully execute a non-breach scenario model run before running the breach or breach scenario.
- Earthen Dams. All earthen dams use the <Breach_Data.xls> spreadsheet to calculate breach time (tf) and breach bottom width (Wb). This spreadsheet calculates four sets of breach parameters using the following four regression equations: MacDonald and Langridge-Monopolis, Froehlich (1995a), Froehlich (2008), and Von Thun & Gillette. Because each scenario modeled for MMC has different loading conditions, a separate tab within the spreadsheet exists for each scenario. MMC guidance for using the breach spreadsheet is as follows:
- Breach invert is set to the elevation of the downstream streambed for all scenarios unless otherwise specified in the Screening Portfolio Risk Assessment (SPRA). The breach invert is consistent across all breach scenarios.
- Breach parameters computed by the spreadsheet are not averaged for use in the model. Select one set of equations that seems reasonable using engineering judgment. The selected equation is used for all breach scenarios at the dam.
- Use the breach formation time calculated by the selected equation.
- Formation time of breach should typically fall in the range of 0.1–4 hours. However, longer formation times may be reasonable, especially for dams with significant volume.
- Breach width is typically one to five times the height of the dam (check the bottom width of the dam between abutments; in some cases this may limit the breach bottom width).
- Breach progression utilizes the sine wave option.
- Manning’s “n” values immediately downstream of the dam are increased in order to simulate accumulated debris in the channel
- Breach Mode is piping for scenarios not overtopping the dam. The piping elevation is set to the breach invert.
- Concrete Dams. All concrete dams have a breach width equal to between one and six monoliths of the study dam.
2.5.2.3 Develop the Pool Breach Scenarios
The breach scenario is developed by copying the non-breach scenario HEC-RAS plan file and inputting breach data into the HEC‑RAS plan file to trigger a breach at the TAS pool elevation.
2.6 Hydrologic Engineering Center-River Analysis System Model Execution and Model Output
Models developed for the MMC Production Center compute all scenarios with minimal computational error. Instability in unsteady HEC-RAS model runs is probable during initial simulation. It is likely to take the modeler several iterations before instabilities are fully addressed in the model. The acceptable level of computational error is relative to the specifics of the project being modeled, but acceptable values are addressed during the model review period and discussed with the production team lead.
2.6.1 Reporting Breach Initiation Time
In order to create consistency in reported breach times by all members of the MMC production team, a standardized method for reporting breach initiation time was adopted. The breach time for a particular scenario is found by opening the model’s DSS file using the HEC-DSSVue program and selecting the C: drop down Breach Bottom-Width. View the table produced for the model run of concern, the first time ordinate is the date and time to report for breach time.
2.6.2 Breach Wave Arrival Time
The breach wave arrival time for MMC is defined as the time at which increased water surface elevation at a given point is the result of a breach of an upstream impoundment structure such as a dam. The breach wave arrival time is calculated by comparing hydrographs at a given location for breach and non-breach scenarios. The conditions of the non-breach scenario should only differ from the breach scenario in the fact that the structure in question fails, increasing the flow capacity at its location. The two hydrographs, plotted together should be identical until the time at which the water surface elevation in the breach hydrograph rises above the non-breach hydrograph, indicating increased flows as a result of the breach. The indicator value for the breach wave arrival is a difference of two feet between hydrograph values.
2.6.3 Removal of Intermediate Outputs from Dataset
The final dataset includes only the relevant output from the final runs and all output from intermediate runs is removed. Particular attention is paid to the DSS output file. As a final modeling step, it is good practice to delete all extraneous plans and output files including the .DSS file and re-run all plans so only HEC-RAS output associated with the final levee breach analysis scenarios is saved. This can also be accomplished by executing a File/Save As to a new location and re-running all of the appropriate MMC plans.
2.6.4 Depth Grids
A resulting maximum depth grid is stored to disk for each modeled scenario. This process is accomplished using HEC-RAS RASMapper tools. The grids are saved in the default location as a sub-folder within HEC-RAS.
2.6.5 Arrival grids
An arrival grid is stored to disk for each modeled scenario. The process is accomplished using HEC-RAS RASMapper tools. The arrival grid is based on a two-foot depth and is referenced to the start of the HEC-RAS simulation. The grids are saved in the default location as a sub-folder within HEC-RAS.
2.6.6 Inundation Boundaries
A resulting maximum extent of inundation boundary shapefile is stored to disk for each modeled scenario. This process is accomplished using HEC-RAS RASMapper tools. The shapefile is saved in the default location as a sub-folder within HEC-RAS.
2.7 Model Report
All models completed for MMC also have a corresponding Simplified Study Analysis Report. This report summarizes pertinent aspects of the modeling effort associated with each scenario. The following summarizes modeler responsibilities for completing the report.
The Simplified Study Analysis Report is housed in the MMC Team SharePoint project folder because multiple members of the MMC production team collaborate to prepare the Simplified Study Analysis Report throughout the production process. Marked up and edited versions of the report are to be maintained on the MMC Team SharePoint site at all times. The modeling production process is not complete until the report has been fully reviewed and submitted to the documentation team.
Pertinent model data is inserted within the Simplified Study Analysis Report and should be provided for the technical model review.
A summary of model assumptions and difficulties should be included within the Model Hydraulic Report to support and facilitate review.
2.8 Delivery of Consequence Data
The modeling team is responsible for processing and compiling the hydraulic model data used by the consequence team member. All post processing efforts are performed within RAS Mapper with the exception of double warning shapefiles. For most rapid assessments, the downstream extent is exclusively 2D and requires fewer files. However, for cases where an existing 1D and/or coupled 1D/2D model is used, additional data may be required. Specifics regarding the files needed for both 1D and 2D models are:
- RAS modeling output, *.hdf, format will be included in the data package sent to the consequence team member for both the TAS Fail and TAS No-Fail scenarios
- The bank line shapefiles (if they exist from previous modeling efforts) are provided as pre-processed files included in the FIA Input shapefiles folder.
- For simplified studies, only the TAS scenario will be assessed.
- Double Warning union shapefiles are created for a dam breach scenario only when there is a population at risk (PAR) for the equivalent non-breach scenario. The modeler determines whether there is a PAR for the non-fail results by viewing the non-fail simulation results in HEC-RAS to see if there are damaging flows. The shapefiles are included in the Consequence Model Input shapefiles folder; guidance on development of double warning files are in Appendix 3.1.14.
- The terrain grid file(s) used in RAS Mapper are included in the FIA Rasters folder; these include all *.tif and *.hdf files.
- The H&H tab, including the scenario timing (i.e., start date, end date, and breach initiation date) are provided in the CTS worksheet.Max_Inundation_Extent boundaries should be included for both scenarios (TAS Fail and TAS No-Fail).
- Depth and Arrival Time grids should be included in both cases
Input data generated for Hydrologic Engineering Center-Flood Impact Analysis (HEC-FIA) modeling is outlined below:
- FIA_InputShapefiles.7z
- 2D Storage Areas (2D only)
- Bank lines (if readily available)
- Inundation boundary polygons
- FIA_Rasters.7z
- Terrain grid (.tif/.hdf)
- Inundation grid (.tif/.hdf)
- Arrival grid (.tif/.hdf)
2.9 Technical Review
The MMC Modeling Team Technical Reviewer reviews the model for accuracy and consistency using the pre-defined simplified assessment review checklist.
- Data is transferred to the MMC File Share project folder or on a hard drive.
- The deliverable includes:
- Working model with TAS breach and non-breach MMC scenarios
- Floodplain inundation polygons for breach and non-breach scenarios
- Filled out Simplified Study Analysis Report and uploaded to the project folder on SharePoint
- CTS worksheet with H&H Data tab filled out and uploaded to the project folder on SharePoint.
- Supplemental reference material beyond that collected by the documentation team uploaded to the project references folder on SharePoint
- Any relevant pre-model data
- Breach parameter worksheets.
Interim review comments are incorporated into the model.
- Review comments provided in the review spreadsheet are addressed
- A response for each comment is required in the review spreadsheet maintained in ProjectWise folder
- Send email communication to reviewer, modeling, consequences, and documentation leads that interim review is complete.
2.10 Model Delivery to Consequences and Mapping
After the review is complete and all issues have been resolved, the modeler updates the modeling, consequences, and documentation leads with the file location and date of completion.
Reports, reference data, and CTS sheets are stored on the MMC internal SharePoint in the project-specific folder.
Section 3 - Consequence Analysis
The MMC consequences team prepares a consequence estimate including property damages, population at risk, and life loss (LL) due to breach. The estimate also provides an estimate of the annual benefits provided by the project and a simplified repair cost estimate.
3.1.1 CONSEQUENCE MODEL INPUTS
3.1.1.1 Structure Inventory
The structure inventory is developed from the National Structure Inventory (NSI) which is developed by HEC from HAZUS and other data sources. The NSI inventory is clipped to the study area. The population values are indexed from their base year to the most recent county population estimates. The dollar values for structure value, content value, and vehicle values are indexed from their base year to the current year. If possible, structures within the highest non-damaging inundation zone are redistributed outside of that zone.
3.1.1.2 Emergency Planning Zones
Emergency planning zones (EPZs) are based on the study area boundary and include polygons which delineate the in-pool area and any downstream double warning area. This is accomplished by combining the study area with the non-fail inundation boundary (typically the MHP non-fail). If only one scenario requires double warning, only one EPZ is required and it is used for all scenarios. If multiple scenarios with different non-fail inundation areas require double warning, those scenarios use separate EPZs.
3.1.1.3 Damage Reaches Shapefile
A damage reaches polygon shapefile is developed in order to aggregate the consequence results to specific reaches. The damage reaches polygon delineates the following six reaches: in-pool, 0 to 3 miles, 3 to 7 miles, 7 to 15 miles, 15 to 60 miles, and greater than 60 miles.
3.1.2 CONSEQUENCE MODEL PARAMETERS
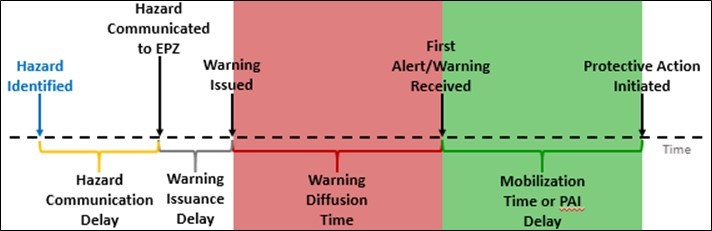
Figure 3-1. Conceptual diagram illustrating the flood warning and evacuation timeline.
3.1.2.1 Hazard Identification Relative Time (Alternative Parameter)
The hazard identification value is the time, in hours, from the imminent hazard defined by the selected hydraulic data. Typically, the hazard is identified relative to breach initiation time. For example, if the scenario states that a levee would be identified to potentially breach three hours prior to the levee breach, the user would enter -3 as the hazard identified relative time (hours). There are two different warning scenarios with different ranges of hazard identification time: minimal warning and ample warning. Minimal warning scenarios have the hazard identification relative time set as a uniform distribution between two hours prior to breach and the time of breach (-2 to 0 hours). Ample warning scenarios have the hazard identification relative time set as a uniform distribution between six hours prior to breach and two hours prior to breach (-6 to -2).
| Warning Scenario | Distribution | Minimum | Maximum |
|---|---|---|---|
| Minimal | Uniform | -2 | 0 |
| Ample | Uniform | -6 | -2 |
3.1.2.2 Hazard Communication Delay (Alternative Parameter)
The hazard communication delay is the time it takes from when the hazard is identified to when the EPZ representatives are notified. For example, if a breach occurs when no one is observing the project, the emergency managers could be notified one hour after the hazard is identified. The hazard communication delay is set as a uniform distribution between .01 hours and .5 hours.
3.1.2.3 Warning Issuance Delay (Emergency Planning Zone Parameter)
The warning issuance delay is the time it takes from when the emergency managers receive the notification of the imminent hazard to when they issue an evacuation order to the public. The warning issuance delay is set at the preset configuration of ‘Preparedness Unknown’.
3.1.2.4 Daytime and Nighttime First Alert (Emergency Planning Zone Parameter)
The first alert parameter defines the warning diffusion curve for daytime and nighttime. The diffusion curve represents the rate at which the PAR receive a first warning alert over time relative to the hazard identification. The first alert curves are set at the preset configuration of ‘Unknown’.
3.1.2.5 Protective Action Initiation (Emergency Planning Zone Parameter)
The protective action initiation (PAI) parameter defines the mobilization curve. The PAI curve represents the percentage of the population which will take protective action over time from when the first alert is received. The PAI/mobilization curve is set at the preset configuration of ‘Preparedness: Unknown/Perception: Unknown’.
3.1.2.6 Number of Iterations (Simulation Parameter)
The number of iterations determines the number of Monte-Carlo iterations the model will run for each event. The number of iterations is typically set at 1,000, although this can be changed to accommodate long run times if necessary.
3.1.2.7 Results Summary Polygon (Simulation Parameter)
The results summarization polygon is the damage reach polygon shapefile.
3.1.3 Running the Consequences Model
Consequences model life loss (LL) analyses uses ample and minimal warning issuances as described in 3.1.2.1. The consequences model includes Monte Carlo simulations utilizing uncertainty around public warning issuance, warning diffusion, and protective action initiation. The median result of the TAS breach model runs are used for CTS Workbook inputs; the statistical results of those runs are included as supplementary tables in the workbook. The Human Impacts tab includes results by reach for the MH, TAS, and NH breach events. Typically, H&H will only provide data for the maximum non-damaging scenario (often TAS non-fail) for use in calibration, but this should also be reported as zero in the CTS worksheets.
The consequences model is simulated for all evaluated scenarios. LL and damage results are checked for reasonableness. The individual structure damage report is reviewed for abnormal results.
In some cases, the largest hydrologic event will not cause the largest LL. This is due to the surprise factor that occurs when the PAR downstream of the dam is warned prior to dam breach. For hydrologic events that are large enough to result in non-fail releases that exceed the downstream channel capacity, some of the PAR will already be warned and will be leaving the area when the dam breach occurs. While larger hydrologic events won't necessarily cause larger LL, the PAR and economic damage should always increase as the non-fail or fail release increases (i.e., PMF should always show the largest PAR and economic damage).
3.1.4 Facility Repair Costs and Project Benefits Foregone
Comprehensive consequence assessments require estimates of total economic impact. These estimates are developed and documented in a consequences toolbox spreadsheet. The following economic consequence categories should be evaluated:
- Facility (asset) repair or replacement costs
- Project benefits foregone
- Water supply
- Hydropower
- Flood risk management
- Navigation
- Recreation
- Other lost benefits.
3.1.4.1 Facility (Asset) Repair or Replacement Costs
One of the consequences of dam breach is the cost to repair the breach or perhaps even to replace the dam. These costs are based on the original construction cost of the dam updated to current monetary values, expected breach characteristics of potential dam breach, estimate by cadre members, or an updated cost estimate from the USACE district.
3.1.4.2 Water Supply
Impacts to water supply include the value of the lost benefit for municipal, industrial, and agricultural use. The total population served by the project will be reported.
3.1.4.3 Hydropower
The value of hydropower benefits lost will be estimated for dams with hydroelectric power plants that will cease electricity production under certain breach scenarios. Breach scenarios that cause loss of pool and/or damage to the power plant will be evaluated for hydropower loss.
3.1.4.4 Flood Damage Reduction
Economic consequences resulting from the loss of the dam’s ability to store flood waters, and thus reduce the risk of downstream flood damages, is a main consideration of dam breach. This benefit is lost until the dam is repaired and can once again provide flood control. The economic consequences are based on historic flood damage prevention estimates, which are calculated every year by the USACE district for the Annual Flood Damage Report to Congress.
3.1.4.5 Navigation
The economic benefit of inland navigation projects is the reduction in the value of resources required to transport commodities and the resulting increase in the value of output for goods and services. Transportation rate savings serve as an estimate of the commercial navigation value of a lock and dam project.
3.1.4.6 Recreation
Annual recreation visits are used to calculate recreation benefits foregone due to lost pools. One of the standard recreation benefit estimation methods is the unit day value method, which is used to estimate recreation benefits foregone due to dam breach.
3.1.4.7 Other Lost Benefits
Some projects have benefits/damages that will not be included in the categories above. An example is non-federal hydropower plants just downstream of a dam. This would not be included in the hydropower lost benefits if it is not an authorized purpose of the project, but can be included in the other lost benefits section because loss of the plant is an economic impact that needs to be included in the overall consequence estimate.
3.1.5 Consequences-Based Top Screen Worksheet
A pre-CTS draft worksheet is available on SharePoint in the Projects folder. This should have the Facility Info tab completed by the documentation team and the H&H data tab completed by the modeler. The consequence team member edits the CTS worksheet in SharePoint, and does not create or download a new version of the worksheet. The member add the economics data to the CTS worksheet that is already posted to the SharePoint site, making sure to maintain all review and source comments on the already completed tabs. In addition to adding data from the Consequences Toolbox, a LL results map provides the TAS breach LL results. This worksheet is used by the documentation lead to complete the consequences portion of the CAR. Status should be listed as Ready for Econ Review.
3.1.6 Review Procedures
The LL, damages, repair cost, and lost benefits estimates are reviewed internally before consequences are considered complete. Reviews are coordinated by the MMC Production Center consequences branch chief and are typically accomplished via webinar.
After the products are approved by the branch chief, the economist addresses any comments. At this time, the economist uploads the finalized consequences model to the appropriate FIA folder on the MMC file share. The modeler, consequences branch chief, and team leads are informed via email of the upload and location.
3.2 Consequence Products
Once the consequences model is complete, the results are processed in the Consequences Toolbox worksheet. Lost benefits and repair costs are also calculated within the toolbox. Once all consequence results are complete, the economist enters the data into the CTS worksheet located on SharePoint in the project folder (see Section 4). This should be done by editing the CTS worksheet directly from SharePoint as opposed to downloading and re-uploading a copy.
Next, the economist completes the consequences section of the Simplified Study Analysis Report following the comments within the report. If the project is a screened out navigation dam, meaning that no modeling was necessary due to lack of downstream consequences, the lost benefits are entered into the Navigation Screening Report completed by the H&H modeler.
3.3 Consequence Review
After all modeling is complete and the CTS worksheet and report are filled in, the MMC Consequences Branch Chief is contacted for project review. Once the review is complete and all comments and issues have been addressed, the consequences model is uploaded to the MMC file share drive in the appropriate project folder. A copy of the Consequences Toolbox is uploaded to the SharePoint folder. Once this is complete, the economist notifies the MMC Consequences branch chief.
Section 4 - Consequences-based Top Screen Worksheet
The MMC documentation team prepares a preliminary pre-CTS worksheet, using the Dam CTS worksheet version 9D, for data collection use and saves it to the project-specific folder on SharePoint. All team members will use the same CTS worksheet. The CTS worksheet should not be opened until information is ready for input and should be saved back at the soonest time possible. Multiple copies of the CTS worksheet should not be created. The status of the CTS worksheet should reflect the names of the finished sections until it is final, i.e., MMC complete; ECON complete.
4.1 Modeling, Mapping, and Consequences Documentation Team
The assigned MMC Documentation Team member completes the following actions using the established, project-specific CTS worksheet.
4.1.1 Contact Information
The team member fills in the project name and the documentation team member name on the MMC Contact Info tab of the CTS worksheet.
4.1.2 Facility Information
The team member fills in the Facility Info tab to the maximum extent possible for the specific project. When filling in the facility information, the member must keep in mind the information may be for an appurtenant structure, therefore, not all headings will exactly correspond to the information available. Information about the main dam does not belong in this CTS worksheet.
Data will be imported directly from the Dam Safety Program Management Tool (DSPMT) into column E—Current DSPMT Value.
Column C, Correct Value, is filled in using information from provided references. The team member annotates the date the information was filled in, the member’s initials, and the reference title and page number where the information came from in column G, Source/Notes
4.1.3 Engineer
4.1.4 Contact Information
The assigned engineer fills in the MMC Engineer contact information on the MMC Contact Info tab of the CTS worksheet.
4.1.5 Data Tabs
The assigned engineer fills in the H&H Data tab for the specific project. The H&H Timing tab will not be filled in.
4.2 Economist
4.2.1 Contact Information
The assigned economist fills in the MMC Economist contact information on the MMC Contact Info tab of the CTS worksheet.
4.2.2 Data Tabs
The assigned economist fills in the Human Impacts, CIPR Data, Econ Tables, and Econ Data tabs for the specific project.
4.3 Technical Review
The MMC Documentation Team Technical Reviewer reviews the content of the CTS worksheet and validates the data within the deliverable and verifies each data field is populated.
Data in the Facility Information tab are verified against the source data and reference materials.
Any errors or questions regarding the data content are directed to the subject matter expert for clarification and edits.
Section 5 - Engineering Data Module Data Entry
5.1 Engineering Data Module Data Entry
The MMC Documentation Team member is assigned to enter the CTS worksheet project data within the Engineering Data Module (EDM) database The assigned documentation member pulls the final CTS worksheet off the MMC Team SharePoint site.
Section 6 - Report
The MMC Documentation Team produces a project-specific template and saves it to the project folder on the MMC Team SharePoint site. Multiple copies of this report should not be created; this will maintain version control of the project documents.
6.1 Simplifed Study Report Workflow
The MMC Documentation Team writer completes the following actions using one of two report templates: the Simplified Study Analysis Report template or the MMC Simplified Study Navigation Screening Report template. The writer uses the Simplified Study Analysis Report template as the starting point for all project report shells as it is unknown from the beginning what type of modeling analysis will be completed per the loading conditions. Only screened-out navigation dams will use the MMC Simplified Study Navigation Screening Report template.
6.1.1 Screened-Out Navigation Dams
During the model analysis, if the modeler determines the project is a screened out navigation dam, a Simplified Study Navigation Screening Report template is used to fill out the study results. The Simplified Study Navigation Screening Report is located at: https://team.usace.army.mil/sites/NWK/pdt/MMC/Shared%20Documents/Forms/AllItems.aspx?.
6.1.2 All Other Projects
All other projects, to include non-navigation projects that screen out, use the Simplified Study Analysis report shell. The Simplified Study Analysis report template is located at: https://team.usace.army.mil/sites/NWK/pdt/MMC/Shared%20Documents/Forms/AllItems.aspx?
The technical writer ensures the input from the modeler and economist is correct within the report by using the CTS worksheet to compare and verify the model and consequences output data. If the information or data within the report is incorrect, the writer contacts the subject matter expert with questions.
More specific details on how the Simplified Study Analysis template is completed are outlined within this section of the technical manual.
6.2 Simplified Study Navigation Screening Report
6.2.1 Modeler
The modeling team posts a screening report with the modeling section complete to the project folder on SharePoint, and the documentation member (reviewer) situated at the Tulsa District becomes the team writer.
6.2.2 Documentation Team
The documentation team member conducts a review of the model content prior to sending an email to the assigned economist to review the model analysis to determine if consequences are viable or not.
The documentation mapper in the Kansas City District produces a study area map extent to be inserted within the final navigation screening report.
6.2.3 Economist
The economist updates the screening report consequences section and the CTS worksheet, if applicable.
6.3 Simplified Study Analysis Report
6.3.1 Documentation Team
6.3.1.1 Project Description
The project description contains basic project characteristics. Information included is gleaned from established reference materials. Any references used for writing this description are included in the references section of the report.
6.3.1.2 Table 1-1—Pertinent Project Data
Table 1-1 is filled in using information from the Facility Info tab of the CTS worksheet.
6.3.1.3 Figure 1-1—Area Map
The area map is placed as Figure 1-1. The map should fill the page.
6.3.1.4 Contact Information
The MMC writer fills in the technical editor and GIS technician contact information in the references section of the report.
6.3.2 Modeler
The assigned modeler completes the following actions using the established, project-specific report template.
6.3.2.1 Model Output
The modeler fills in the non-broiler plate portions of the model output section based on information in the CTS worksheet.
6.3.2.2 Tables 2-1 and 2-2
Tables 2-1 and 2-2 are filled in based on information from CTS worksheet. Data in Table 2-1 will be rounded to tenths. Data in Table 2-2 will be rounded to hundreds.
6.3.2.3 Contact Information
The assigned engineer fills in the engineer contact information in the reference section of the report.
6.3.3 Economist
The assigned economist completes the following actions using the established, project-specific report template.
6.3.3.1 Consequence Analysis Section
The economist fills in the non-broiler plate portions of the consequences section based on information in the CTS worksheet.
6.3.3.2 Tables 3-1, 3-2, and 3-3
Tables 3-1, 3-2, and 3-3 are filled in based on information from the CTS worksheet.
6.3.3.3 Contact Information
The assigned economist fills in the economist contact information in the reference section of the report.
6.4 Map
An MMC documentation GIS technician creates an area map and posts it to the project folder on SharePoint.
After the map is complete, the GIS technician updates the documentation team and the Report Tracker (located on the MMC Team SharePoint site) with the technician’s name and the date of completion.
6.5 Technical Edit
The MMC documentation team technical editor edits the document for spelling, punctuation, grammar, and content. Any issues found regarding content are directed to the assigned subject matter expert for the section.
Additionally, the technical editor corrects formatting as needed.
After the edit is complete and all issues have been resolved, the editor updates the documentation team tracker (located on the RMC File Share) with the technical editor’s name and the date of completion.
6.6 Technical Review
The MMC documentation team technical reviewer reviews the technical content of the report and verifies data corresponds to the data gathered in the CTS worksheet. Any issues found regarding content are directed to the assigned subject matter expert for the section.
Section 7 - Finalize
The MMC documentation member creates a PDF version of the final report.
The documentation lead coordinates with the project manager, and updates the MMC schedule database with project report status. The mapping team lead posts final reports to the Corps of Engineers Dam and Levee Safety Database.
| 1D | one-dimensional |
| 2D | two-dimensional |
| ACE-IT | Army Corps of Engineers-Information Technology |
| CEDALS | Corps of Engineers Dam and Levee Safety ProjectWise Server |
| CIPR | Critical Infrastructure Protection and Resilience |
| COP | community of practice |
| CTS | consequences-based top screen |
| DSPMT | Dam Safety Program Management Tool |
| EAS | Emergency Alert System |
| ESD | Enterprise Service Desk |
| GIS | Geographic Information System |
| HAZUS-MH | Hazards U.S., Multi-Hazard analysis system |
| HEC-FIA | Flood Impact Analysis |
| HEC-RAS | River Analysis System |
| ID | identification |
| LOP | line of protection |
| LRH | Huntington District |
| MHW | mean high water |
| MMC | Modeling, Mapping and Consequences |
| NAVD 88 | North American Vertical Datum of 1988 |
| NED | National Elevation Dataset |
| NH | normal high |
| NID | National Inventory of Dams |
| NLCD | National Land Cover Database |
| NLD | National Levee Database |
| NOAA | National Oceanic and Atmospheric Administration |
| NSI | National Structure Inventory |
| NWK | Kansas City District |
| OCR | optical character recognition |
| PAR | population at risk |
| portable document format | |
| PMF | probable maximum flood |
| RAS | Rapid Assessment Screening |
| SOP | standard operating procedure |
| SPRA | Screening Portfolio Risk Assessment |
| TAS | top of active storage |
| tf | breach time |
| USACE | U.S. Army Corps of Engineers |
| Wb | breach bottom width |
| WCM | water control manual |
| WPC | western processing center |